🖥️ Executor Memory
Every Spark executor is a JVM process launched on a worker node. Its total memory is carved into several distinct regions, each with a specific purpose. Misconfiguring even one of these regions is the root cause of most OutOfMemory errors, slow shuffles, and containers being killed by the cluster manager.
This guide breaks down each memory region, provides the exact formulas Spark uses internally, and maps every block to its spark.* configuration property so you can go from theory to tuning immediately.
The Executor Memory Layout
The total memory requested from the cluster for a single executor is:
Total Container Memory = spark.executor.memory + Memory Overhead
This is a critical distinction: spark.executor.memory controls only the on-heap JVM portion. The cluster manager (YARN, Kubernetes) allocates a larger container that also includes the overhead.
Here is the full breakdown, with each block tied to its configuration property:
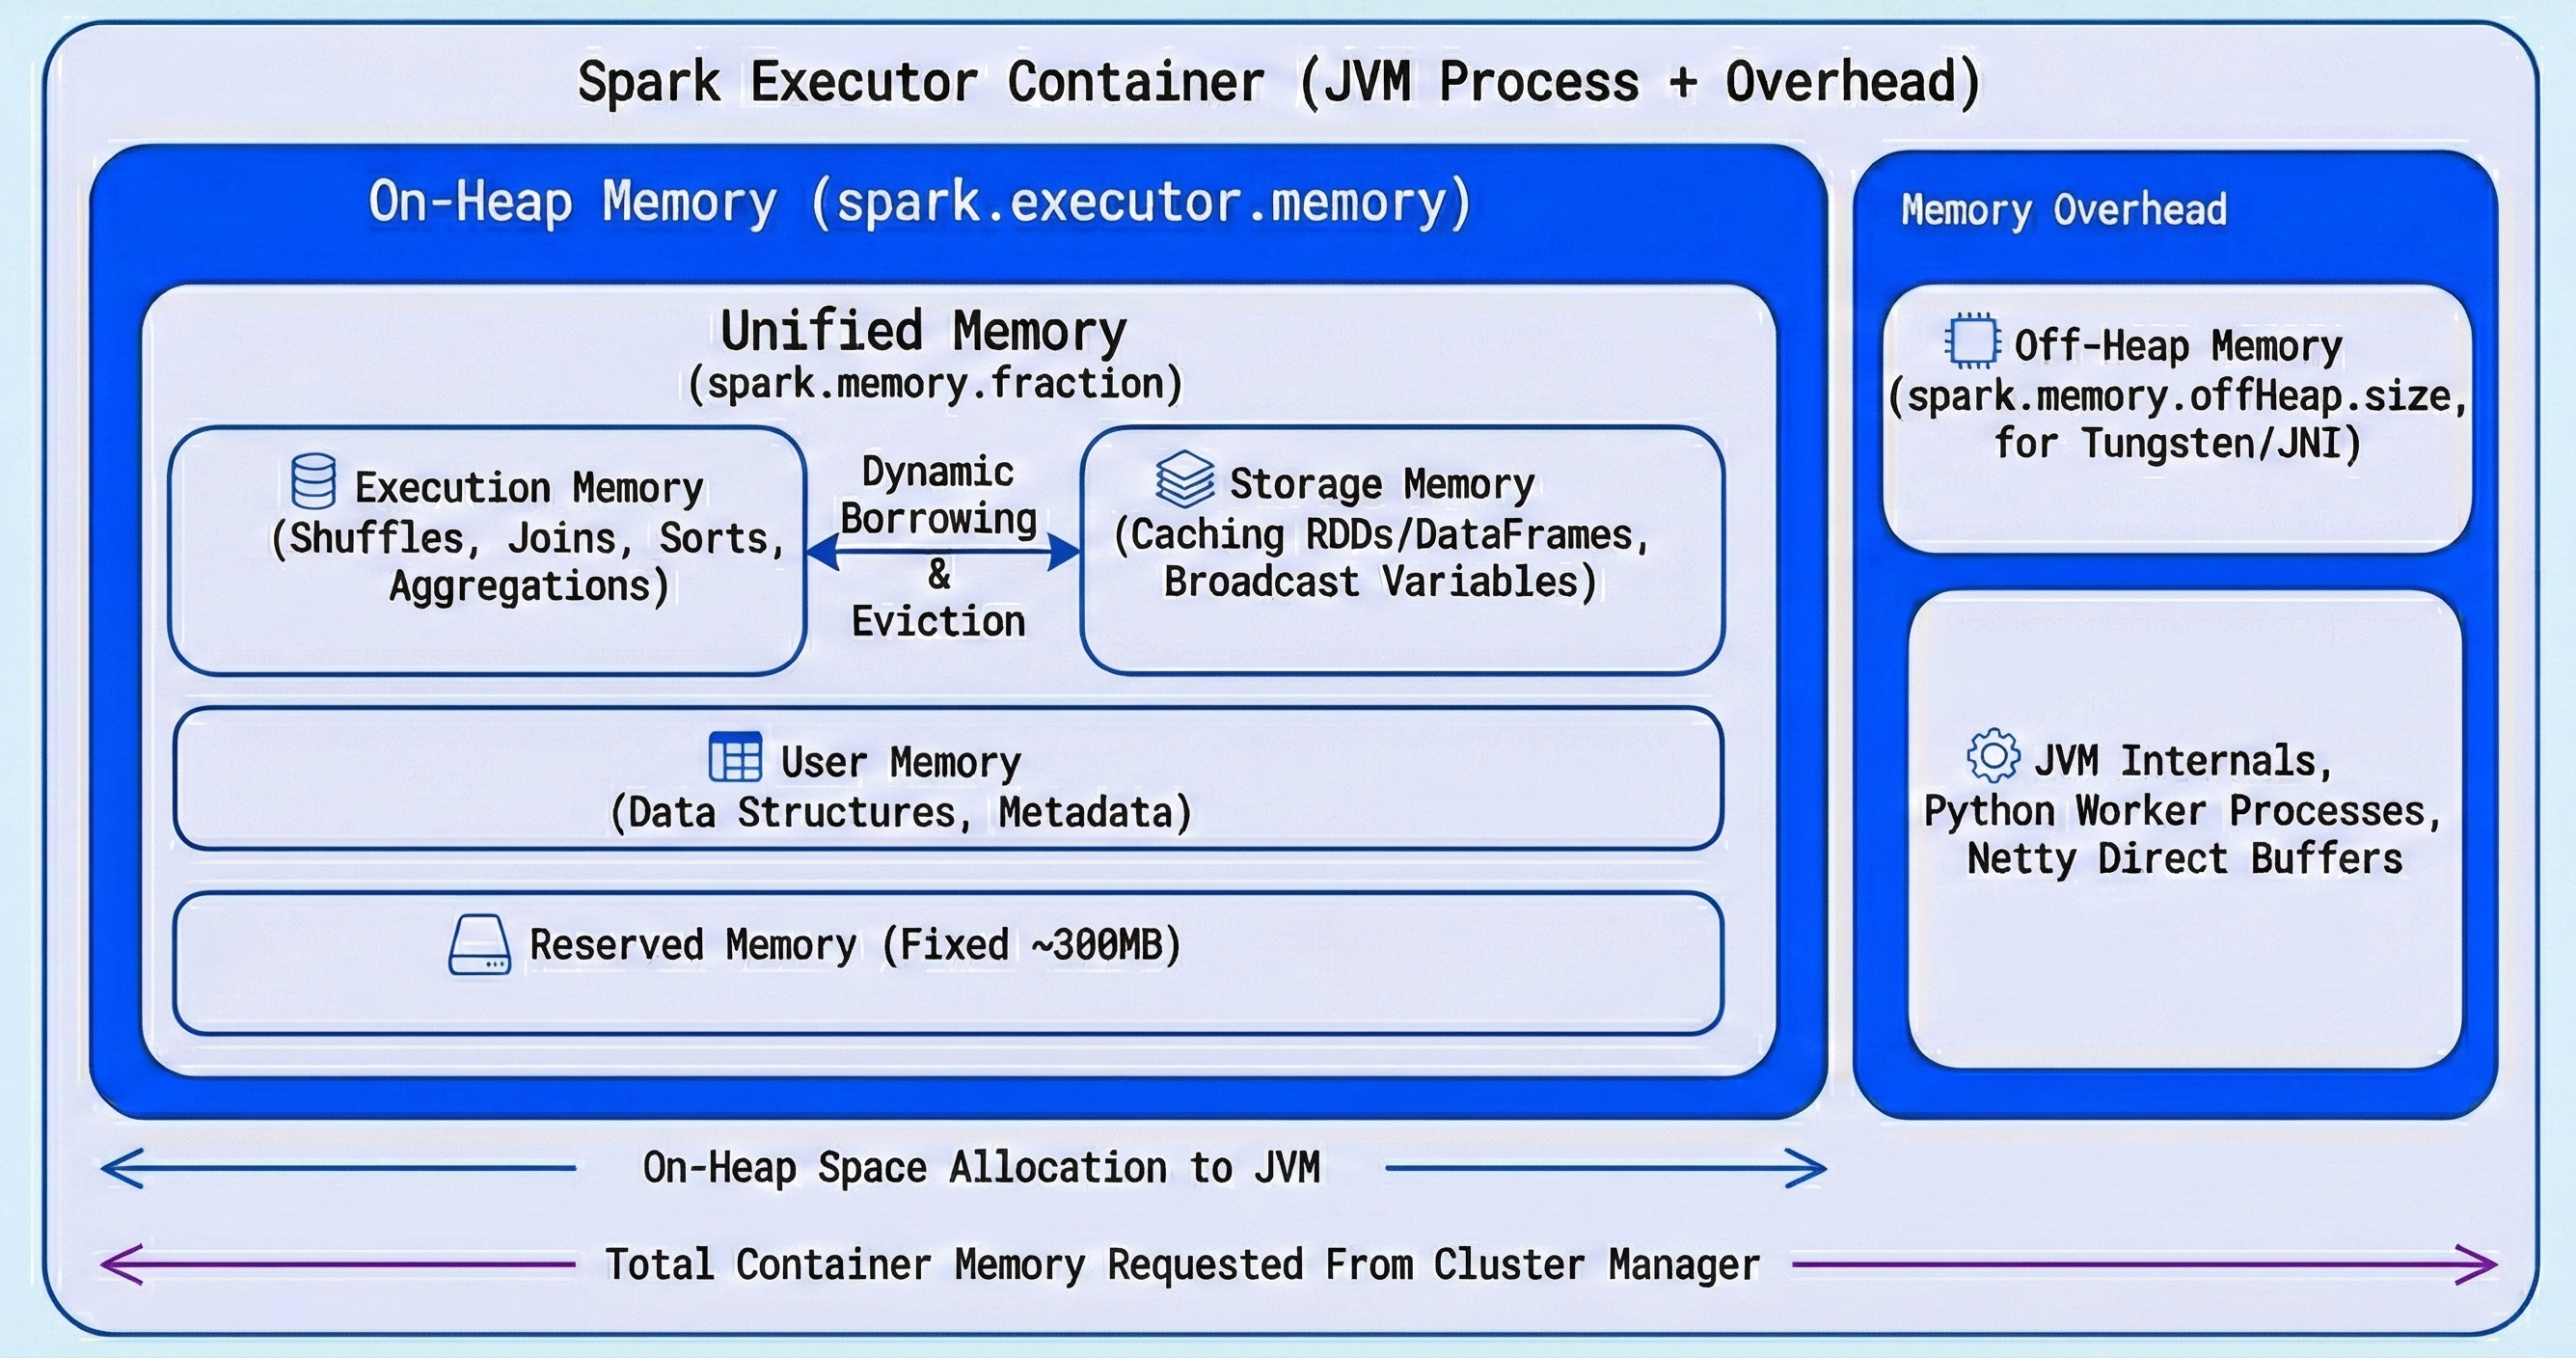
| Memory Region | Configuration Property | Default | Description |
|---|---|---|---|
| On-Heap Memory | spark.executor.memory | 1g | Total JVM heap allocated to the executor. |
| - Unified Memory | spark.memory.fraction | 0.6 | Fraction of (heap - reserved) for execution + storage. |
| - Execution Memory | (within unified) | 50% of unified | Shuffles, joins, sorts, aggregations. |
| - Storage Memory | spark.memory.storageFraction | 0.5 | Cached DataFrames/RDDs, broadcast variables. |
| - User Memory | (remainder) | ~40% of heap | User data structures, internal metadata, UDF objects. |
| - Reserved Memory | (hardcoded) | 300 MB | Internal Spark bookkeeping. Not configurable. |
| Memory Overhead | spark.executor.memoryOverhead | max(384MB, 10% of spark.executor.memory) | Off-heap memory for JVM internals, Python workers, native libs. |
| Off-Heap Memory | spark.memory.offHeap.size | 0 (disabled) | Optional Tungsten-managed memory outside the JVM heap. Must enable with spark.memory.offHeap.enabled=true. |
On-Heap Memory (The JVM Heap)
Set via spark.executor.memory, this is the main memory pool and is divided into three logical areas.
Reserved Memory (300 MB)
A fixed, non-configurable 300 MB chunk that Spark reserves for its own internal objects and safety margin. If spark.executor.memory is set below 1.5x of this (i.e., below ~450 MB), Spark will throw an error and refuse to start.
Unified Memory
This is where Spark does its real work. The exact formula is:
Unified Memory = (spark.executor.memory - 300 MB) × spark.memory.fraction
Not simply "60% of spark.executor.memory" as often stated. The reserved memory is subtracted first.
Worked example with spark.executor.memory = 10g:
Unified Memory = (10240 MB - 300 MB) × 0.6 = 9940 MB × 0.6 = 5964 MB
Unified Memory is dynamically shared between two sub-pools:
Execution Memory
Used for intermediate data during shuffles, joins, sorts, and aggregations. This memory holds buffers, hash tables, and sort arrays that active tasks need.
Storage Memory
Used for caching DataFrames/RDDs (df.cache(), df.persist()) and holding broadcast variables.
The initial split between them is controlled by spark.memory.storageFraction (default 0.5), but this boundary is dynamic — both pools can borrow from each other when idle capacity exists. The rules governing this dynamic boundary are important to understand:
The Dynamic Boundary Rules:
| Scenario | What Happens |
|---|---|
| Storage is idle, Execution needs more | Execution borrows from Storage freely. |
| Execution is idle, Storage needs more | Storage borrows from Execution freely. |
| Execution needs its space back that Storage borrowed | Execution can forcefully evict cached blocks from Storage to reclaim memory. Storage blocks are evicted using LRU (Least Recently Used). |
| Storage needs its space back that Execution borrowed | Storage cannot evict Execution memory. It must wait until tasks finish and Execution releases the memory naturally. |
The key takeaway: Execution memory always wins. This asymmetry exists because evicting execution data mid-task would mean restarting expensive computations, while evicting cached data only means re-reading it from disk later.
User Memory
Whatever remains after Unified Memory and Reserved Memory:
User Memory = (spark.executor.memory - 300 MB) × (1 - spark.memory.fraction)
With defaults, this works out to roughly 40% of (heap - reserved). This space holds your own data structures, UDF objects, internal Spark metadata, and any objects created by custom transformations. This region is not managed by Spark's memory manager — you are responsible for staying within its bounds.
Memory Overhead
Set via spark.executor.memoryOverhead, this memory lives outside the JVM heap and is added on top of spark.executor.memory when requesting a container from the cluster manager.
Default Overhead = max(384 MB, spark.executor.memory × 0.10)
This region covers:
- JVM internals: Thread stacks, class metadata, native method allocations, string interning.
- PySpark Python workers: Each PySpark task spawns a separate Python process that lives entirely outside the JVM (more on this below).
- Off-heap libraries: Native libraries (snappy, lz4 compression) and NIO direct buffers.
If the total memory used by the executor (heap + overhead) exceeds what the cluster manager allocated for the container, the container is killed externally — you will not see a Java exception but rather a cryptic exit code from the cluster manager (see the troubleshooting section).
Off-Heap Memory (Optional)
Spark can optionally allocate a pool of memory outside the JVM heap for Tungsten-optimized operations. Enable it with:
spark.memory.offHeap.enabled = true
spark.memory.offHeap.size = <bytes>
Off-heap memory is not subject to JVM garbage collection, which eliminates GC pauses on large heaps. Spark's Tungsten engine manages this memory directly using sun.misc.Unsafe, giving it C-like memory performance.
When enabled, this memory is used in addition to on-heap unified memory for execution and storage operations. It is counted as part of the memory overhead from the cluster manager's perspective.
Spill-to-Disk: What Really Happens When Memory Runs Out
A common misconception is that when Execution Memory runs out, the task immediately fails with an OOM error. In reality, Spark has a spill-to-disk mechanism that acts as a safety net.
When Execution Memory is full during operations like shuffles, sorts, or aggregations:
- Spark serializes the in-memory data structures to local disk (the shuffle spill files).
- The task continues processing by reading spilled data back from disk when needed.
- Performance degrades (disk I/O is orders of magnitude slower than memory) but the task does not fail.
An OOM error only occurs when even the spill mechanism cannot keep up — for example, when a single data structure (like a giant hash map for a skewed join key) must fit entirely in memory and exceeds the available space.
You can observe spill behavior in the Spark UI under the Stages tab:
- Shuffle Spill (Memory): The size of deserialized data in memory before spilling.
- Shuffle Spill (Disk): The size of serialized data written to disk.
If you see significant spill-to-disk, it is a strong signal that you need more Execution Memory (increase spark.executor.memory or reduce spark.memory.storageFraction).
PySpark-Specific Memory Architecture
When using PySpark, the memory picture gets more complex because PySpark introduces a two-process model.
How PySpark Executes Code
Spark tasks on the JVM side communicate with separate Python worker processes via sockets. Each executor spawns one or more Python processes depending on the workload:
- DataFrame API operations (e.g.,
df.filter(),df.groupBy()) are fully optimized by Catalyst and executed on the JVM. Python is only used to build the logical plan — no Python worker is needed at runtime. - Python UDFs (
@udf,@pandas_udf) and RDD operations (rdd.map(),rdd.filter()) require actual Python execution. Each task spawns or reuses a Python worker process that receives data from the JVM, processes it in Python, and sends results back.
These Python workers live entirely outside the JVM heap and consume memory from the Memory Overhead region. This is why PySpark applications with UDFs often need a much larger spark.executor.memoryOverhead than pure Scala/Java applications.
Relevant PySpark Memory Properties
| Property | Default | Description |
|---|---|---|
spark.executor.memoryOverhead | max(384MB, 10%) | Increase this for UDF-heavy PySpark workloads. A common starting point is 20-30% of spark.executor.memory. |
spark.executor.pyspark.memory | 0 (unlimited within overhead) | Caps the Python worker memory per executor. When set, it is added to the overhead for container sizing. |
spark.python.worker.memory | 512m | Threshold per Python worker before it spills data to disk. Not a hard cap — it controls when the worker starts writing to disk. |
spark.python.worker.reuse | true | Reuses Python workers across tasks to reduce process spawn overhead. |
Cluster Manager Interactions: YARN & Kubernetes
Understanding how the cluster manager enforces memory limits is critical for diagnosing container kills.
How Container Memory is Calculated
The total memory that YARN or Kubernetes allocates per executor container:
Container Memory = spark.executor.memory
                 + spark.executor.memoryOverhead
                 + spark.executor.pyspark.memory  (if set)
                 + spark.memory.offHeap.size       (if enabled)
The cluster manager treats this as a hard ceiling. If the executor's actual physical memory usage exceeds this at any moment, the container is killed.
Decoding Exit Codes
| Exit Code | Meaning | Typical Cause |
|---|---|---|
| 137 | Container killed by SIGKILL | Cluster manager (YARN/K8s) detected memory usage above the container limit. The process is killed immediately — no chance for a stack trace. |
| 143 | Container killed by SIGTERM | Graceful termination requested by the cluster manager, often due to preemption or memory pressure on the node. |
When you see these exit codes (especially 137), the fix is almost always to increase spark.executor.memoryOverhead rather than spark.executor.memory. The JVM heap itself might be fine, but off-heap allocations, Python workers, or native libraries pushed the container past its limit.
YARN-Specific Behavior
YARN checks physical memory usage of each container periodically. If yarn.nodemanager.pmem-check-enabled is true (default), YARN kills any container that exceeds its allocated memory. You can also encounter this if yarn.nodemanager.vmem-check-enabled is true and the virtual memory ratio is exceeded.
Kubernetes-Specific Behavior
On Kubernetes, each executor pod gets a memory limit set on the container spec. The kernel's OOM killer (oom_score_adj) terminates the process when memory is exceeded. Unlike YARN, there is no periodic check — the OS kernel handles enforcement directly.
Garbage Collection (GC) Tuning
Since on-heap memory is managed by the JVM, garbage collection directly impacts performance. Long GC pauses can cause tasks to time out, executors to lose heartbeats with the driver, and overall throughput to drop.
Why GC Matters for Executor Memory
- User Memory is most affected by GC because it holds user-defined objects with unpredictable lifetimes.
- Storage Memory holding cached data can create a large number of long-lived objects that make GC work harder.
- Frequent GC pauses during shuffle operations can significantly slow down Execution Memory processing.
Recommended GC Settings
For most Spark workloads, the G1 Garbage Collector performs well because it targets short pause times and handles large heaps efficiently.
spark.executor.extraJavaOptions=-XX:+UseG1GC -XX:InitiatingHeapOccupancyPercent=35
| GC Option | Purpose |
|---|---|
-XX:+UseG1GC | Enables the G1 collector, designed for heaps > 4 GB with low-latency requirements. |
-XX:InitiatingHeapOccupancyPercent=35 | Starts GC cycles earlier (at 35% heap usage) to avoid emergency full-GC pauses. |
-XX:ConcGCThreads=4 | Number of threads for concurrent GC work. Tune if you have many cores per executor. |
You can monitor GC behavior by enabling GC logging:
spark.executor.extraJavaOptions=-XX:+UseG1GC -Xlog:gc*:file=/tmp/gc.log
Then review the logs for long pause times. If individual GC pauses exceed 1-2 seconds, consider reducing spark.executor.memory and increasing executor count, or shifting more work to off-heap memory.
Configuration Examples
spark-submit
spark-submit \
  --master yarn \
  --deploy-mode cluster \
  --driver-memory 4g \
  --executor-memory 8g \
  --executor-cores 4 \
  --num-executors 10 \
  --conf spark.executor.memoryOverhead=2g \
  --conf spark.memory.fraction=0.6 \
  --conf spark.memory.storageFraction=0.5 \
  --conf spark.executor.extraJavaOptions="-XX:+UseG1GC -XX:InitiatingHeapOccupancyPercent=35" \
  --conf spark.memory.offHeap.enabled=true \
  --conf spark.memory.offHeap.size=2g \
  my_spark_job.py
PySpark SparkSession.builder
from pyspark.sql import SparkSession

spark = (
    SparkSession.builder
    .appName("MemoryTunedJob")
    .config("spark.executor.memory", "8g")
    .config("spark.executor.cores", "4")
    .config("spark.executor.instances", "10")
    .config("spark.executor.memoryOverhead", "2g")
    .config("spark.memory.fraction", "0.6")
    .config("spark.memory.storageFraction", "0.5")
    .config("spark.executor.extraJavaOptions", "-XX:+UseG1GC -XX:InitiatingHeapOccupancyPercent=35")
    .config("spark.memory.offHeap.enabled", "true")
    .config("spark.memory.offHeap.size", "2g")
    .getOrCreate()
)
Airflow SparkSubmitOperator (Airflow 3+)
from airflow.providers.apache.spark.operators.spark_submit import SparkSubmitOperator

spark_job = SparkSubmitOperator(
    task_id="memory_tuned_spark_job",
    application="/path/to/my_spark_job.py",
    conn_id="spark_default",
    executor_memory="8g",
    executor_cores=4,
    num_executors=10,
    driver_memory="4g",
    conf={
        "spark.executor.memoryOverhead": "2g",
        "spark.memory.fraction": "0.6",
        "spark.memory.storageFraction": "0.5",
        "spark.executor.extraJavaOptions": "-XX:+UseG1GC -XX:InitiatingHeapOccupancyPercent=35",
        "spark.memory.offHeap.enabled": "true",
        "spark.memory.offHeap.size": "2g",
    },
)
Common Memory Errors & Fixes
| Error / Symptom | Root Cause | Fix |
|---|---|---|
java.lang.OutOfMemoryError: Java heap space | On-heap memory exhausted. Often caused by skewed data, large broadcasts, or too many cached datasets. | Increase spark.executor.memory. Reduce spark.memory.storageFraction if caching is not needed. Check for data skew. |
java.lang.OutOfMemoryError: GC overhead limit exceeded | JVM spending >98% of time in garbage collection. Too many objects in User Memory or Storage. | Enable G1GC. Reduce number of cached objects. Increase executor memory or reduce executor cores (fewer concurrent tasks = less memory pressure). |
Container killed by YARN for exceeding memory limits / Exit code 137 | Physical memory of the container exceeded the allocated limit. Off-heap usage or Python workers grew beyond the overhead. | Increase spark.executor.memoryOverhead. For PySpark UDF workloads, set overhead to 20-30% of spark.executor.memory. |
| Exit code 143 | Container terminated (SIGTERM) by the cluster manager due to preemption or node-level memory pressure. | Increase overhead. On YARN, check if node labels or queues are constraining resources. |
| Excessive Shuffle Spill (Disk) in Spark UI | Execution Memory too small for the shuffle/sort/aggregation. Data is being serialized to disk. | Increase spark.executor.memory or lower spark.memory.storageFraction (e.g., 0.2) to give more room to Execution. |
ExecutorLostFailure: Container killed on request. Exit code 137 repeated across executors | Cluster-wide memory pressure. Executors are being consistently OOM-killed. | Reduce spark.executor.cores (fewer concurrent tasks per executor), increase overhead, or increase the number of executors with smaller individual memory to spread the load. |
| Slow performance but no errors | Likely heavy GC pauses or excessive spill. | Check Spark UI's Executor tab for GC time. Enable GC logging. Consider off-heap memory or G1GC tuning. |
Quick-Reference Cheat Sheet
Memory formula at a glance:
Container = spark.executor.memory + Overhead [+ pyspark.memory] [+ offHeap.size]

On-Heap (spark.executor.memory):
├── Reserved Memory          = 300 MB (fixed)
├── Unified Memory           = (heap - 300 MB) × spark.memory.fraction
│   ├── Storage Memory       = Unified × spark.memory.storageFraction
│   └── Execution Memory     = Unified × (1 - spark.memory.storageFraction)
└── User Memory              = (heap - 300 MB) × (1 - spark.memory.fraction)

Overhead = max(384 MB, spark.executor.memory × 0.10)
Tuning quick reference:
| Workload Type | Recommended Tuning |
|---|---|
| Shuffle-heavy (joins, groupBys) | Lower spark.memory.storageFraction to 0.2 to maximize Execution Memory. |
| Cache-heavy (repeated reads, iterative ML) | Raise spark.memory.storageFraction to 0.7 to maximize Storage Memory. |
| PySpark with UDFs | Increase spark.executor.memoryOverhead to 20-30% of executor memory. Set spark.executor.pyspark.memory if needed. |
| Large heaps (>10 GB) | Enable G1GC. Consider enabling off-heap memory to reduce GC pressure. |
| Frequent container kills (exit 137) | Increase spark.executor.memoryOverhead. Check for memory-hungry Python processes or native libraries. |